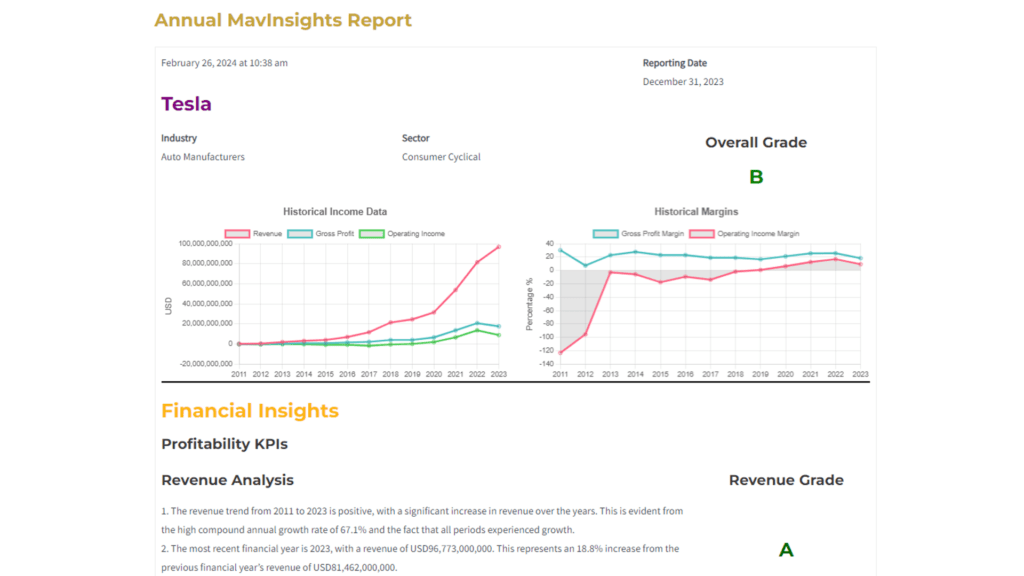
Gives you indepth insights into your business KPIs
MavInsights provides an in-depth analysis of various Key Performance Indicators (KPIs) that are essential in driving and enhancing a company’s value.
Global Performance Benchmarking: This platform offers a significant advantage by enabling businesses to benchmark their performance against industry peers on major global stock exchanges such as the NYSE, NASDAQ, AMEX, London Stock Exchange, Australian Securities Exchange, Hong Kong Stock Exchange, Singapore Exchange, and Kuala Lumpur Stock Exchange. This benchmarking provides a clear perspective on competitive strengths and areas needing improvement within a global context.
Grading System for Performance Evaluation: Each KPI is meticulously graded on a scale from A to E, with A representing the highest level of performance and E indicating critical areas that require immediate attention and substantial enhancement. This grading system simplifies the evaluation process, allowing businesses to quickly ascertain their overall standing in comparison to their industry counterparts.
In-depth KPI Analysis: MavInsights conducts a thorough evaluation of each Key Performance Indicator by analyzing historical trends, volatility, benchmark comparisons etc. This analysis reveals patterns and fluctuations that inform strategic decision-making. By examining KPI performance against peers on major global exchanges like NYSE and NASDAQ, businesses gain insights into their competitive positioning and risk factors. This detailed scrutiny not only highlights strengths but also identifies areas needing improvement, empowering companies to make informed decisions that enhance operational effectiveness and foster sustainable growth.
Tailored Recommendations for Strategic Improvement: Furthermore, MavInsights not only highlights areas needing improvement but also offers tailored recommendations to enhance the performance of underperforming KPIs. These insights are designed to guide strategic decisions, fostering improved business outcomes and sustained growth. By leveraging MavInsights, companies gain access to actionable data that is crucial for maintaining competitive advantage in today’s dynamic market environment.
Enhanced Visual Analytics: MavInsights enhances its KPI analysis with advanced graph features, providing users with clear, intuitive visual representations of data. These graphs enable a quick and easy review of trends and relationships between various KPIs, helping businesses visualize their performance over time and against industry benchmarks. By integrating these graphical tools, MavInsights allows companies to better understand complex data sets and draw actionable insights more effectively. This visual approach is especially beneficial for identifying patterns, assessing volatility, and comparing performance metrics, facilitating more informed decision-making and strategic planning.
